
The Ratings Tools menu
The Tools menu is where you tailor what shows on your ratings. Here's every switch, panel and view it holds, and what each one does.
Click ⚙ Tools at the top of the ratings grid and the Ratings Tools panel opens. It's where you decide exactly what appears on your cards, and changes apply straight away, so you can flick things on and off and watch the grid respond.
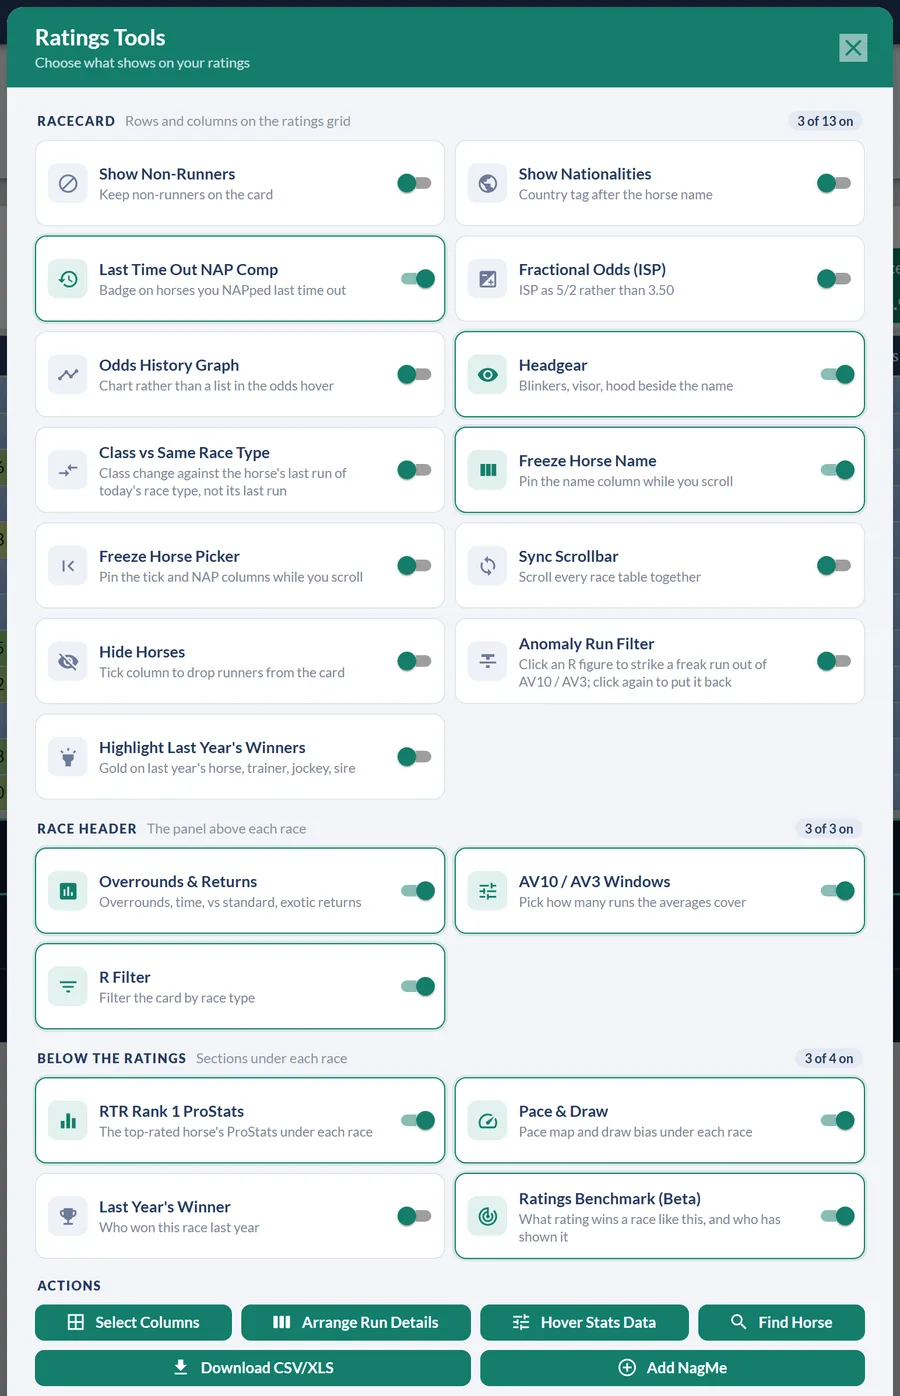
Racecard, rows and columns on the grid
- Show Non-Runners: keep non-runners on the card instead of dropping them off. A non-runner's row now has a line struck right through it, so it cannot be mistaken for a runner at a glance.
- Show Nationalities: add the country tag (GB, IRE, FR…) after each horse's name.
- Last Time Out NAP Comp: put a badge on any horse you selected in the NAP Competition last time out.
- Fractional Odds (ISP): show the industry SP as a fraction (5/2) rather than a decimal (3.50).
- Odds History Graph: show the odds history as a chart rather than a list when you hover the odds.
- Headgear: show blinkers, a visor, a hood and the rest beside the name. See Headgear on the ratings.
- Class vs Same Race Type: base the Class column on the horse's last run of today's race type, rather than its most recent run of any type.
- Freeze Horse Name: pin the Horse Name column in place while you scroll the columns sideways.
- Freeze Horse Picker: pin the tick and NAP columns too, so your picks stay in view as you scroll across.
- Sync Scrollbar: scroll every race table together, so all your open cards move as one.
- Hide Horses: add a tick column so you can drop individual runners from the card (it only hides them from your view).
- Anomaly Run Filter: click an R figure to strike a freak run out of AV10 and AV3, and click it again to put it back. See The Anomaly Run Filter. Premium and Professional.
- Worth Knowing: the facts our tools noticed about each race, as a section under the grid. Off by default, Premium and Professional. See Worth Knowing.
- Highlight Last Year's Winners: pick out last year's winning horse, trainer and sire in gold.
- Last Year: Winner / 2nd / 3rd / Also Ran: four switches that colour today's runners by where they finished in this race last year, a gold, silver or bronze cell for the first three and a plum name for anyone else who ran in it. All on by default, each independent, Professional only. See Last Year's Winner.
- Alternative Colours: repaint the shading from red to green into orange to teal, for anyone who finds red and green hard to tell apart. See Alternative Colours.
Race header, the panel above each race
- Overrounds & Returns: the overrounds, the winning time against standard, and the exotic returns (exacta, forecast, trifecta, tricast).
- AV10 / AV3 Windows: choose how many runs the AV10 and AV3 averages cover. See AV windows.
- R Filter: filter the card down to a single race type (Flat, hurdle, chase and so on), with a going toggle that leaves only the runs on ground like today's. See Going bands.
Below the ratings, sections under each race
- RTR Rank 1 ProStats: the ProStats breakdown for the top-rated horse, under each race. A Professional feature. See RTR Rank 1 ProStats under each race.
- Pace & Draw: the pace map and draw bias for the race. See Pace & Draw.
- Last Year's Winner: who won this race last year. See Last Year's Winner.
- Ratings Benchmark (Beta): what sort of rating tends to win a race like this, and which of today's runners have already shown it.
Every member now sees all four of these sections. Where one is above your plan, a strip in its place names the tier it belongs to, so you can see what's there rather than wondering what you're missing.
Actions
- Select Columns: choose exactly which columns appear, and drag them into your own order. See Customising your ratings view.
- Arrange Run Details: drag the cards and rows of the R figure Run Details hover into your own order, and switch off any row you don't use.
- Hover Stats Data: choose which figures (SR, Wins, A/E, P&L, ROI, PR) appear in the strike-rate hover.
- Find Horse: look up any horse by name, not just today's runners, and jump to its page.
- Download CSV/XLS: export the card to a spreadsheet. See Download the ratings.
- Add NagMe: add a horse to your NagMe list.
Stats view, what the stat columns and hovers count
This one switch changes every strike-rate column at once:
- WS, Win Stats: every stat column reads as a win strike rate: how often that factor (the trainer, jockey, sire, course, distance and so on) has won. This is the default.
- PS, Place Stats: the same columns as place strike rates: how often each factor placed. Handy for each-way and place markets.
- WP, Win Price Reduction: not a strike rate at all: the average percentage the win price shortened in running for that factor, and how often it came in by 25%, 50% or 75%. It shows you what the market got behind late.
See WS, PS & WP views explained for more on the three. This one switch also changes what the strike-rate hover counts. You can switch on a quick WS / PS / WP toggle in the toolbar from this panel, so you can flip between the three views in a click without opening Tools each time.
Was this article helpful?