
What do the R figures (R1 to R10) mean?
The R Figures are our calculated performance figures that the horses have achieved. R1 is that horse's most recent run, R2 their 2nd most recent run and so on.
R Figures
The R Figures are our calculated performance figures for each run. R1 is a horse's most recent run, R2 their second most recent, and so on back to R10. Each figure is a weighting of both performance and speed.
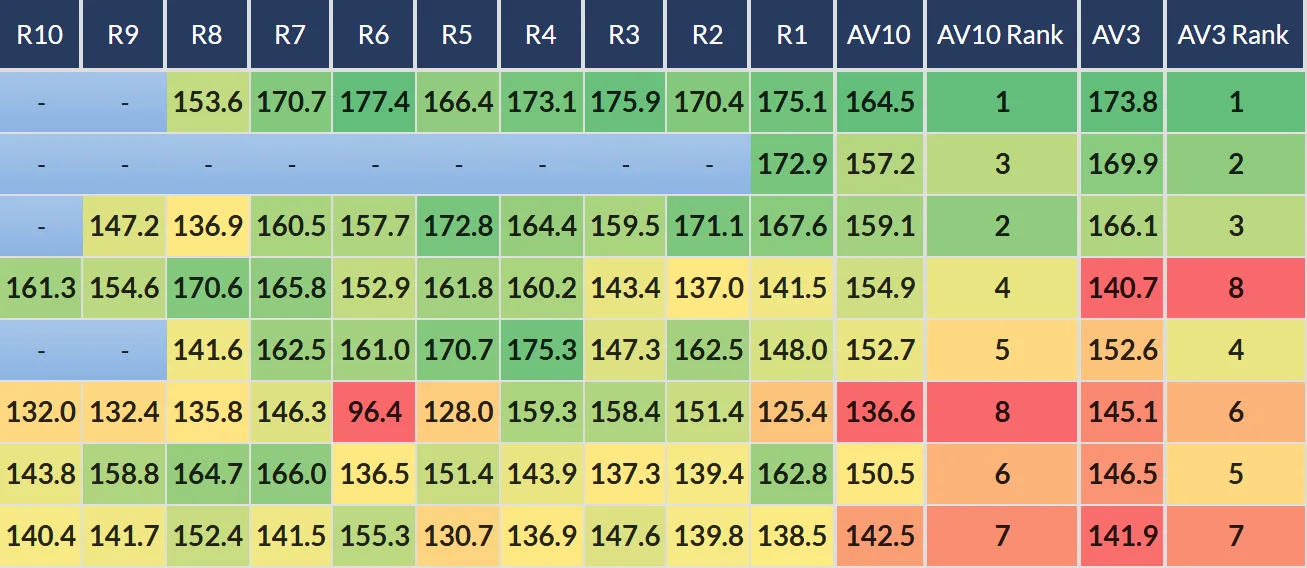
In the example above, the horse at the top posted the best last-time-out figure, and went on to win this race too.
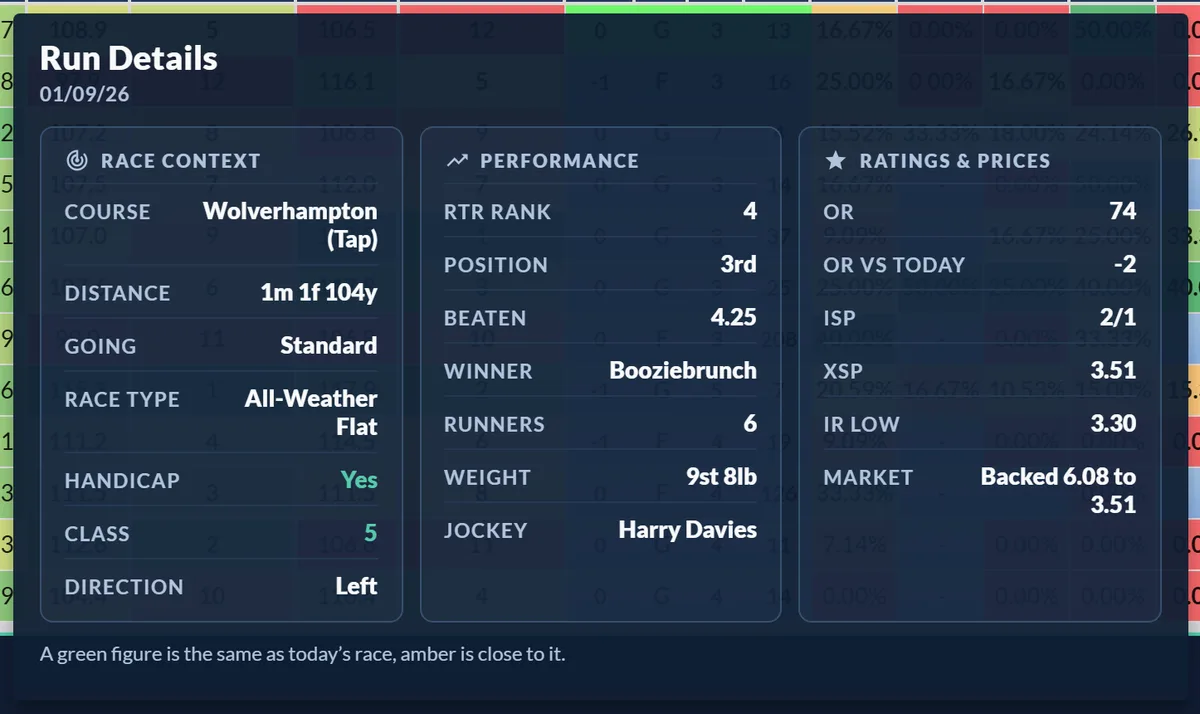
Hover your mouse over any R figure to open its Run Details, laid out as three cards:
- Race Context: the course, distance, going, race type, whether it was a handicap, the class and the direction it turned, with the date in the header.
- Performance: its RTR Rank that day, its exact finishing position (14th, rather than the form figure's 0), how far it was beaten, the winner (or, on a winning run, the horse it beat), the field size, the weight carried and the jockey.
- Ratings & Prices: the official rating (and how it compares with today's mark), the industry and exchange SP, the in-running low (and the in-running high on a winning run), and how the market moved before the off.
Anything matching today's race, the same course, trip, going, type, class or direction, is picked out in green, and a near match (a similar trip or going) in amber, so you can see at a glance how relevant a strong figure really is.
Arrange the hover your way
Everyone reads form differently, so the hover is yours to lay out. Open Tools on the ratings and choose Arrange Run Details: drag the cards left or right, drag the rows up or down within a card, and switch off any row you never look at. It's remembered in your browser for next time. See The Ratings Tools menu.
Where R figures fit in
The R figures feed directly into other parts of the ratings. The averages of these scores become the AV3 and AV10 ratings, see What do AV3, AV10 and their ranks mean?, and Professional members can rank a whole field by its most recent figure using the R1 Rank. For how every column on the grid relates to these, see the full ratings columns reference.
Was this article helpful?