
Movers & Shakers and the price chart
Movers & Shakers shows where the money went: the horses being backed and the ones going out, with each race's price chart one click away.
Movers & Shakers is the market card on your dashboard, on the Trading tab. It follows the exchange prices of every runner on the day and lists the horses whose price has moved the most, with a price chart for every race. It is for Premium and Professional members.
Steamers and drifters
- A steamer is a horse being backed: its price is shortening because money is coming for it.
- A drifter is the opposite: its price is lengthening as support goes elsewhere.
The card has a tab for each, with a count, and shows up to 15 horses on each. It looks again every 2 minutes on its own.
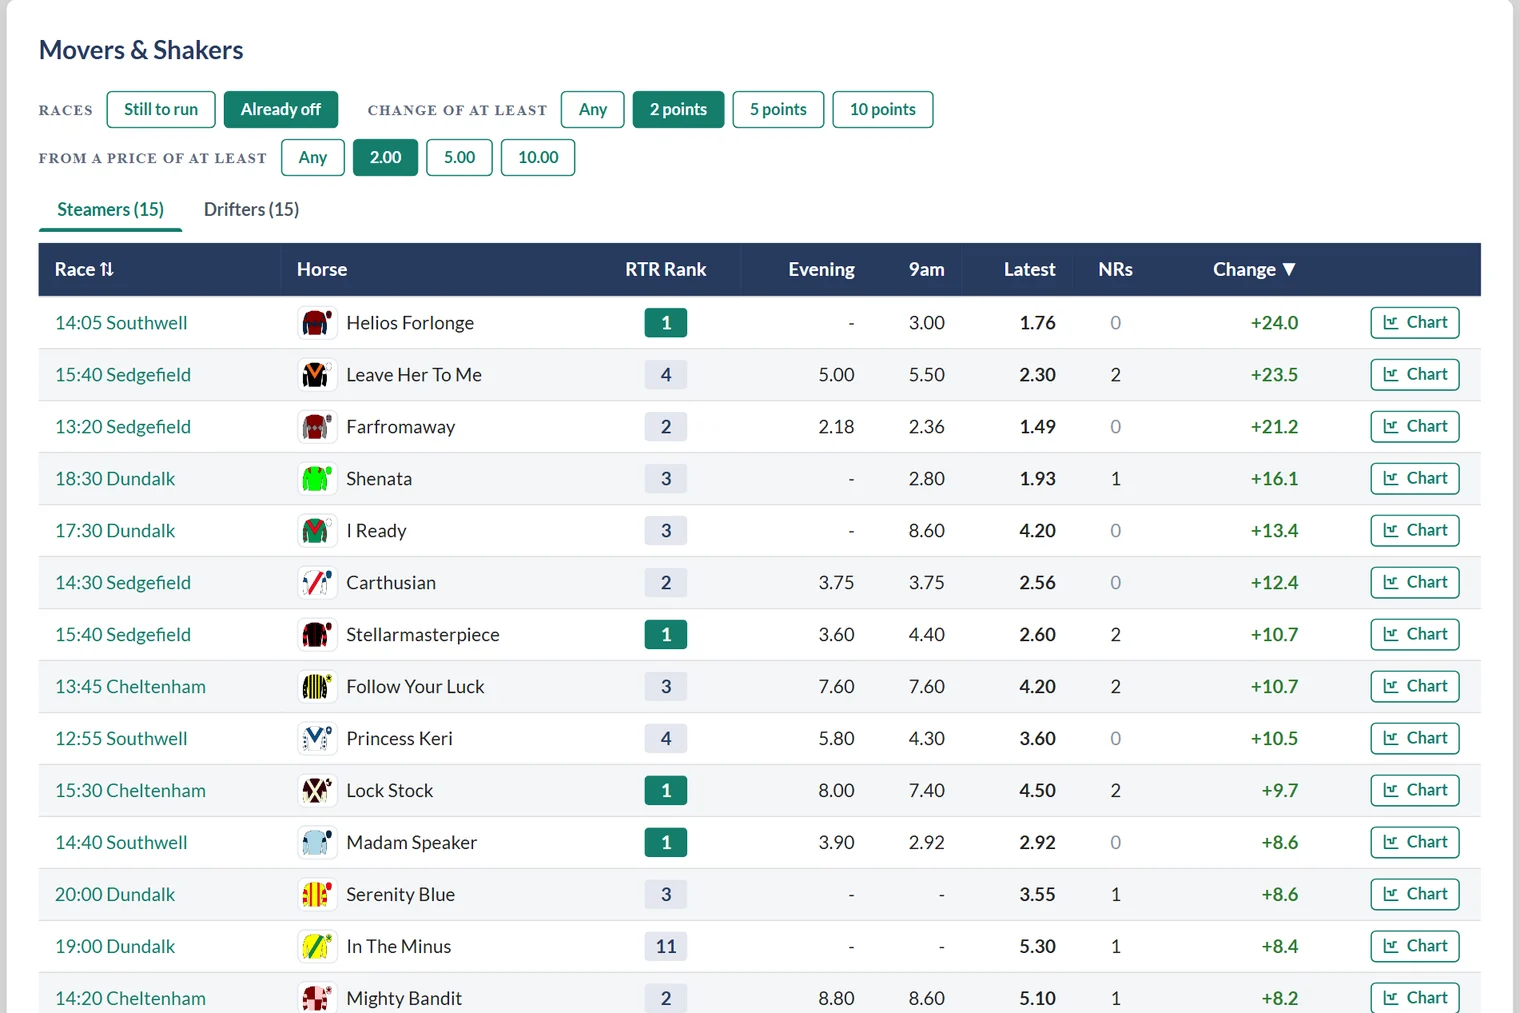
Still to run or Already off
Races: Still to run (the default) lists moves in the races yet to go off. Already off lists the day's races that have gone, with each horse's last price before the off, so you can look back over the whole day's market after racing.
Reading a row
- Race: the time and course, a link to the racecard. Click the Race header to sort by time.
- Horse, with its silks.
- RTR Rank: where our ratings have it in that race.
- Evening: its price the evening before. This column only appears when at least one horse in the list has an evening price; the evening market is often too thin to give one. If you measure from 8am (below), this column is 8am instead.
- 9am: its price at 9am on the day.
- Latest: its price now, or its last price before the off on Already off.
- NRs: the number of non-runners in its race. A non-runner shortens every horse left in, so a big move in a race with non-runners is partly the non-runners.
- Change: how far the move went, in points of chance. A horse that goes from 4.00 to 2.00 has gone from a 25% chance to a 50% chance, so its Change is +25. It is measured from the Evening price, or from the first sound price of the day where there was none the evening before. You can measure from 8am instead (below). Hover a Change figure to see the price and time it was measured from. Click the Change header to sort by it.
We measure moves in points of chance rather than in raw odds because a move from 3.00 to 2.50 is a far bigger statement than one from 51 to 41.
Prices from very thin early markets are left out, so the list is not led by moves that never really happened.
The filters
Two rows of buttons above the tabs narrow the list, and work the moment you press them:
- Change of at least: Any, 2 points (the default), 5 points or 10 points.
- From a price of at least: Any, 2.00 (the default), 5.00 or 10.00, so very short priced horses, whose moves say little, are left out.
Your choices are kept in the page's link, so you can send someone exactly the list you are looking at.
Measure from: Evening or 8am
Measure from, the buttons after Races at the top of the card, sets where every Change is measured from: Evening, the price the evening before (the default), or 8am on race day. The evening market is thin and its prices run short, so measured from the evening, more horses show as drifters. 8am starts from a fuller market. Your choice is saved to your account and is used on the racecard too. See Measure from: the evening before or 8am.
The price chart
Press Chart on any row, or anywhere on the row, and the race's price chart opens.
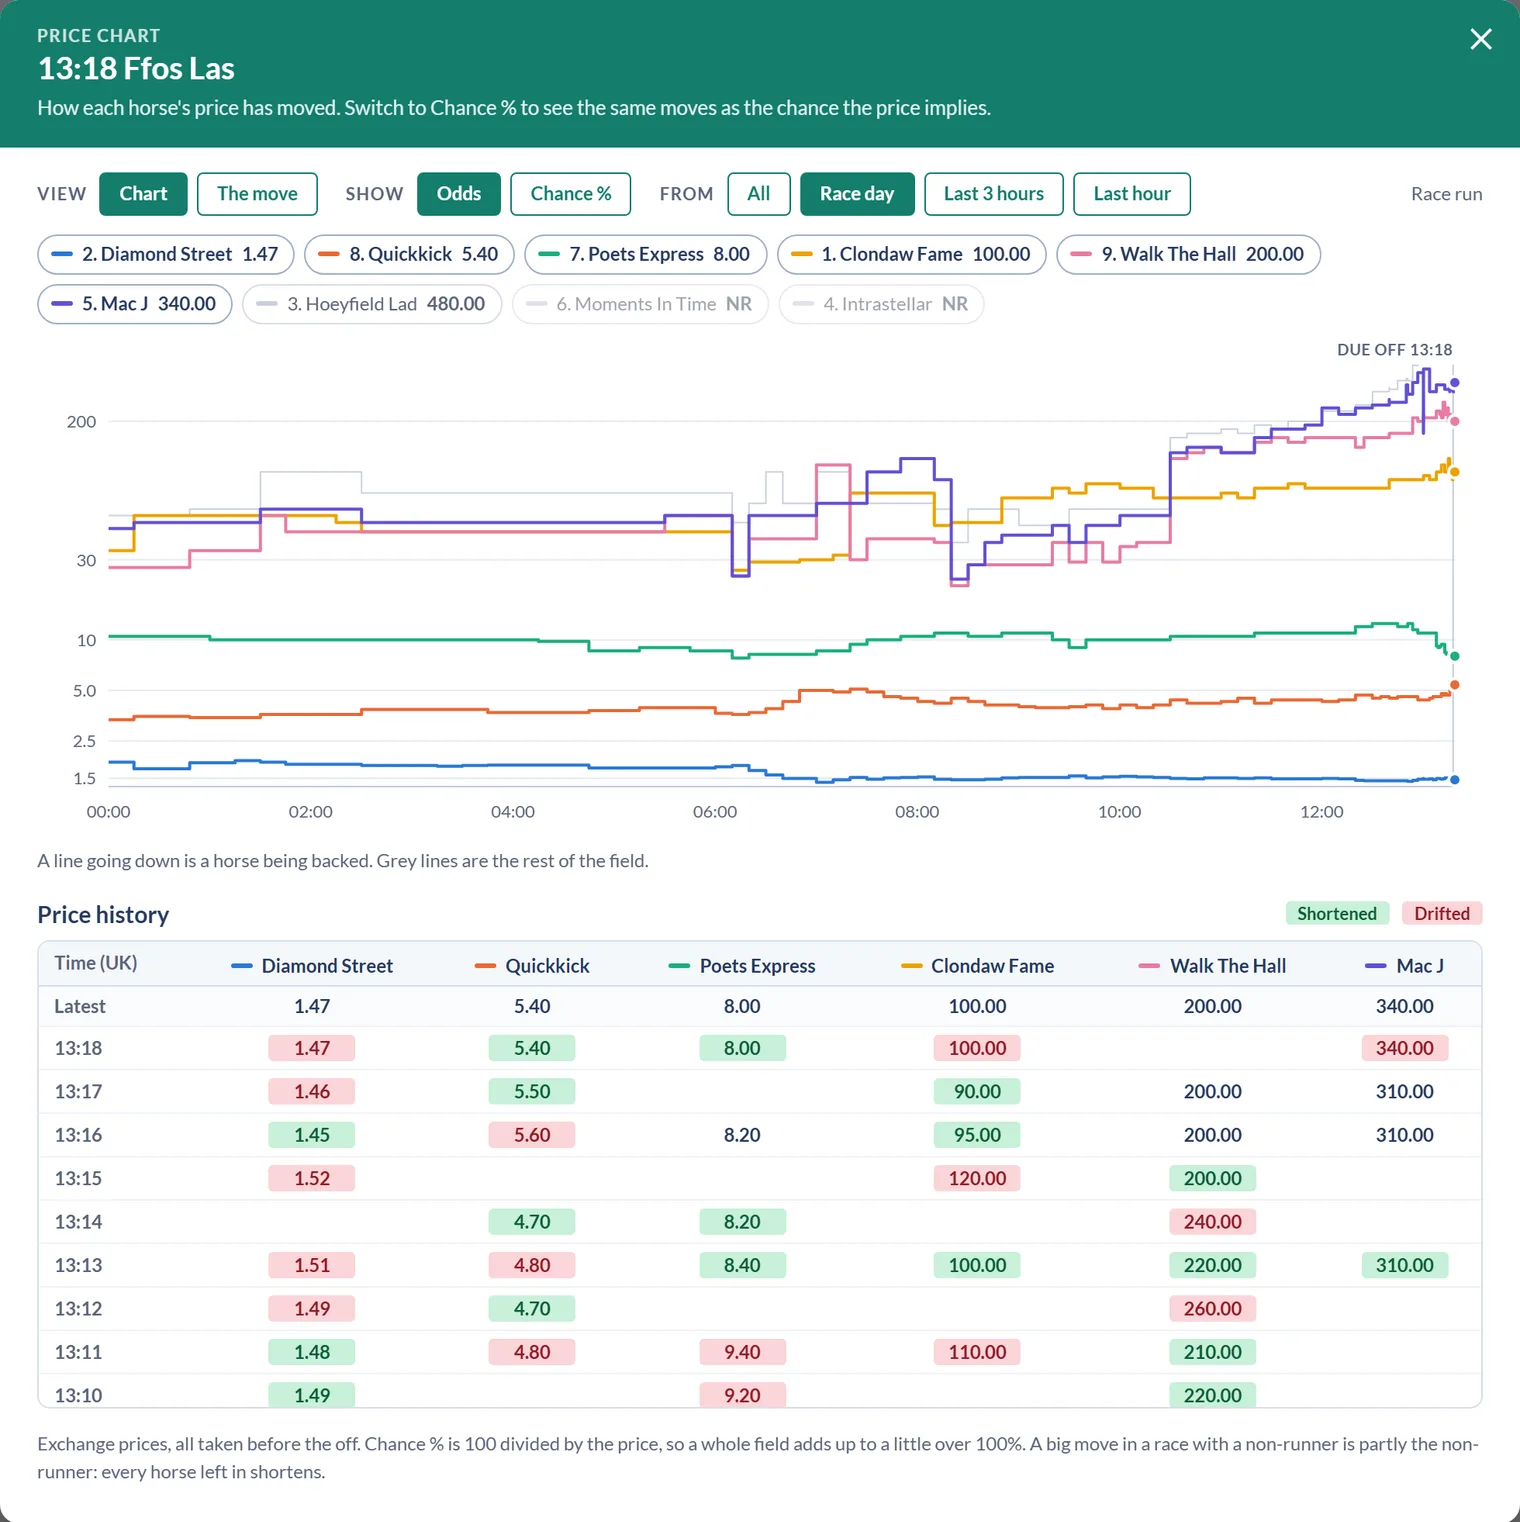
- One line per horse, drawn as its price moved. The horse you came from is drawn first, with the head of the market alongside it. A line going down is a horse being backed. Grey lines are the rest of the field.
- Show: Odds or Chance %. Chance % shows each price as the chance it implies (100 divided by the price), so a line going up is a horse being backed. A whole field adds up to a little over 100%, because the market has its margin built in. The chart remembers your choice.
- From: All, Race day, Last 3 hours or Last hour sets the time range. It opens on Race day when we hold prices from the evening before.
- The runner chips along the top turn each horse's line on or off. Up to 6 lines are drawn in colour, so they stay easy to tell apart. A non-runner shows NR.
- Price history, underneath, lists the same prices as a table: the latest first, then each time a price moved, with shortened prices in green and drifted ones in red.
- View: Chart or The move. At the top left, Chart is the price chart described here. The move shows one horse's market in points of chance from the opening to the off, with non-runners and the margin taken out. It also shows how much of its strongest support the horse still has, with a button to its trainer's market record. It has its own article: Market moves and trainer records.
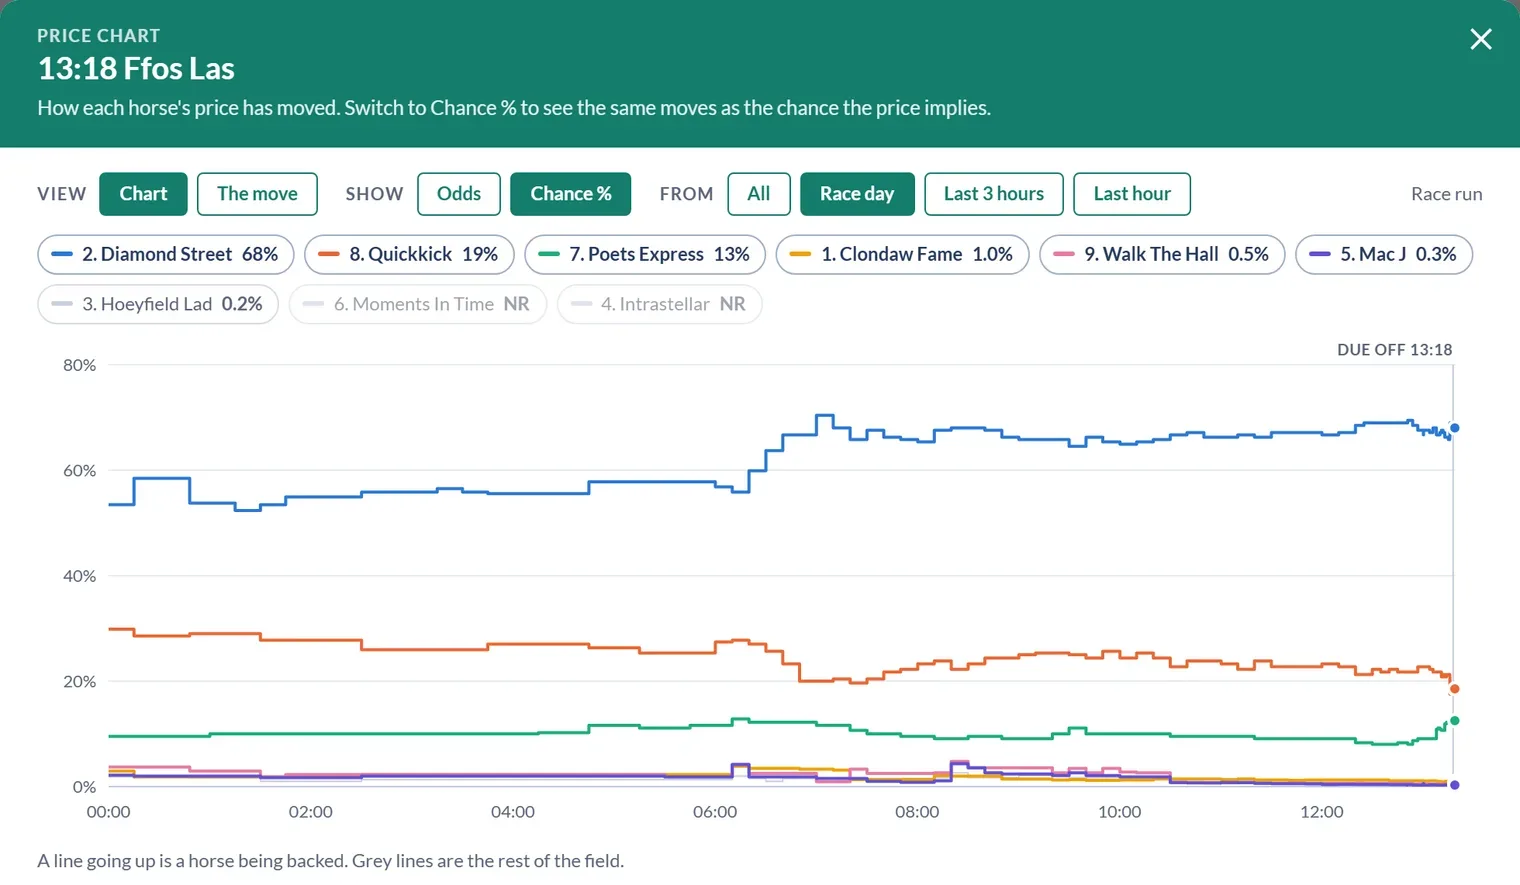
While a race is still to run, the chart keeps itself up to date every minute and shows when it was last updated. Once the race is off it reads Race run.
On the racecard
The same chart is on every racecard. Switch the card to the Odds Movement view (Premium) and a Price chart button appears in the view bar. Opened from the card, it starts with the head of the market.
Beside the button sits a Book chip, for example Book 101% · 2 non-runners, moves adjusted. The percentage is what the exchange chances of the runners add up to: close to 100% is a tight market, and well over means thin prices, where moves count for less. When the race has non-runners, the chip says how many, and that the moves have been adjusted for them. The view also carries Move Adj. and Holding columns, explained in Market moves and trainer records.

Using it sensibly
A price move tells you what the market thinks, not what will win, and backing horses simply because they are being backed is not a strategy we can recommend. Treat a big move as a prompt to look at the race again, alongside the ratings and the Exchange SP.
Was this article helpful?