
Market moves and trainer records
How far the money has really moved for each horse, whether the move is holding, and what moves like it have meant for its trainer, read from the exchange market with non-runners and the margin taken out.
The Odds Movement view and the price chart show you where the money has gone. These tools go a step further: how far each horse has really been backed or eased once non-runners and the market's margin are taken out, whether that support is still there, and what moves like it have meant for the horse's trainer. Everything is worked out from our own exchange price snapshots for every runner.
There are 3 parts:
- Move Adj. and Holding: 2 columns on the racecard's Odds Movement view, with a Book chip beside the Price chart button.
- The move: a second view inside the price chart, with one horse's market from the opening to the off.
- The trainer market record: opened from The move, it shows how the yard's runners have done when the market moved like this.
Who it's for
| Tool | Premium | Professional |
|---|---|---|
| Move Adj. and Holding | Yes | Yes |
| The Book chip | Yes | Yes |
| The move, in the price chart | Yes | Yes |
| The trainer market record | No | Yes |
Premium members see everything on the racecard and in the price chart. The trainer market record is for Professional members: where a Professional member sees the trainer button under The move, a Premium member sees Upgrade to Professional. Free members don't have the Odds Movement view or the price chart, so these tools don't show for them.
Chance, in points
Every figure here is a chance: 100 divided by the horse's exchange price, scaled so that the chances of the horses still running add up to 100%. A move is the change in that chance, in points. A horse that goes from an 18.3% chance to 27.9% has been backed +9.6 pts.
Points keep moves in proportion. A horse cut from 2/1 to 6/4 has gained about 7 points of chance. One cut from 50/1 to 40/1 has gained 0.5 points, though as odds the 2 moves look much the same.
Move Adj. and Holding on the racecard
- Open any racecard.
- In the VIEW strip above the grid, press Odds Movement.
- Move Adj. and Holding sit straight after the Move column.
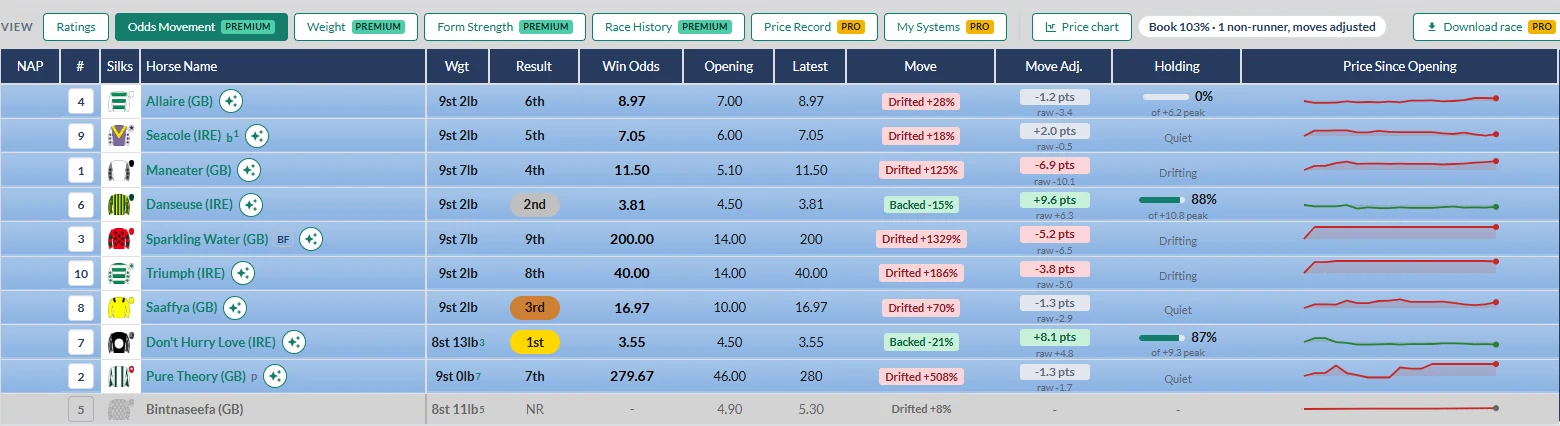
Move Adj.
Move Adj. is the move in the horse's chance since the market opened, in points, with non-runners and the market's margin taken out. The raw figure sits underneath in small grey: the same move worked out straight from the prices, with nothing taken out.
The pill is coloured so you can read the field at a glance:
- Green: backed, by 3 pts or more.
- Red: drifting, by 3 pts or more.
- Grey: quiet, within 3 pts either way.
Click the Move Adj. header to sort the field by it, biggest support first.
Holding
Holding shows how much of its strongest support a backed horse still has, as a bar and a percentage, with its peak underneath. In the screenshot, Danseuse reads 88% of +10.8 peak: at her strongest she had been backed +10.8 pts, and she kept 88% of that move to the off. Allaire reads 0% of +6.2 peak: she was backed that far on the morning of the race, then gave all of it back.
Holding only shows when a horse's best support was at least 3 pts. Otherwise the cell reads Drifting or Quiet, to match its Move Adj.
The Book chip
Beside the Price chart button, a chip reads something like Book 103% · 1 non-runner, moves adjusted. The book is what the exchange chances of all the runners add up to. Close to 100% is a tight market. Well over 100% means the prices are thin, and moves count for less. Where horses have come out, the chip counts them, so you know the moves have been adjusted for them. Hover the chip for a reminder.
Move Adj., Holding and the Book chip refresh every minute until the race is run.
Move and Move Adj. side by side
Opening, Move and the price line now start from the same place as Move Adj.: the first properly formed market, not the first price we saw. A thin early market can throw up a price nobody could have backed, and measuring from it made the 2 columns disagree.
They still measure different things. Move is the change in the price itself, as a percentage. Move Adj. is the change in the horse's chance, in points, with non-runners and the margin taken out. So when a horse comes out and every price left shortens, Move can read Backed while Move Adj. stays grey and quiet: the price fell, but nobody backed the horse.
Why the moves are adjusted
A raw price move can mislead in 3 ways, and Move Adj. deals with all of them.
- Non-runners. When a horse comes out, every price left in the race shortens. On raw prices that looks like support for every horse, when nobody has backed anything.
- The margin. An early, thin market adds up to well over 100%, so its prices look shorter than each horse's real share of the race. By the off the book is usually close to 100%. Taking the margin out puts the opening and the off on the same footing.
- The opening. We measure from the first properly formed market: at least 80% of the runners priced, with the book between 90% and 130%. That is usually the evening before. Thinner markets before that throw up prices nobody could have backed.
The adjustment can go either way. A non-runner makes a raw move look bigger than it was. A big margin at the opening does the opposite for a backed horse, because its opening chance looked bigger than it really was. At Southwell the opening market added up to more than 120%, so Danseuse's raw move of +6.3 pts became +9.6 pts once the margin and the non-runner were taken out.
The move, in the price chart
- On the Odds Movement view, press Price chart.
- At the top left of the pop-up, VIEW has 2 buttons: Chart, the price lines you already know, and The move.
- Press The move.
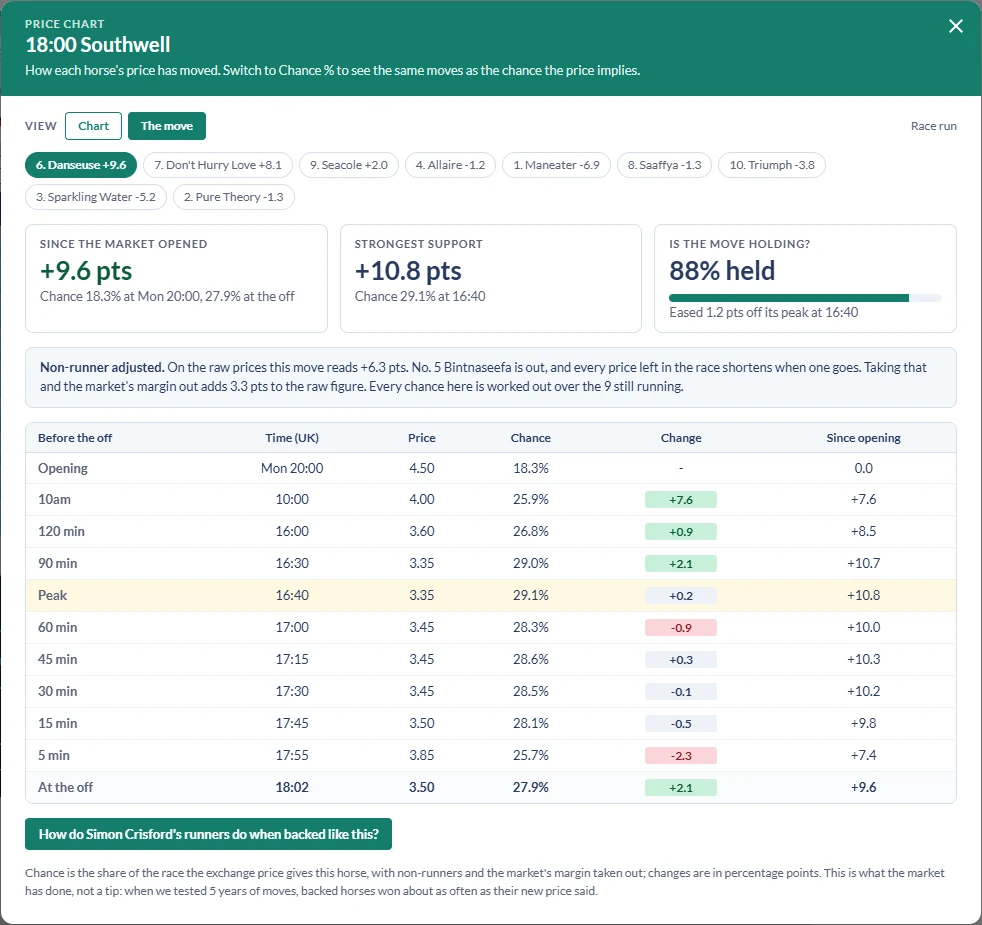
The horse chips
Along the top there is a chip for every runner with its adjusted move, in market order. Press one to switch the panel to that horse.
The 3 tiles
- SINCE THE MARKET OPENED: the adjusted move, with the chance at the opening and at the off (or now, before the race). Danseuse: +9.6 pts, from 18.3% at 20:00 on the Monday evening to 27.9% at the off.
- STRONGEST SUPPORT: the furthest the horse was backed, and when. Danseuse: +10.8 pts, a 29.1% chance at 16:40.
- IS THE MOVE HOLDING?: how much of that support the horse still has. Danseuse: 88% held, having eased 1.2 pts off her peak.
A horse that was never backed 3 pts or more reads Drifting or Quiet in the last tile, because it has no move to hold.
The note
Under the tiles, a note gives the raw figure next to the adjusted one. When a horse has come out it starts Non-runner adjusted., names the non-runner (or counts them, when more than 1 is out) and says every chance is worked out over the horses still running. With no non-runners it starts Margin taken out. and gives the book.
The checkpoint table
One row for each point before the off: Opening, 10am, 120 min, 90 min, 60 min, 45 min, 30 min, 15 min and 5 min, a Peak row where the strongest support fell, then At the off. Before the race, the last row reads Now.
- Time (UK): the checkpoint.
- Price: the exchange price at that moment.
- Chance: the adjusted chance.
- Change: the move since the row above, in points. Green when the chance went up, red when it went down, grey when it barely moved.
- Since opening: the running total from the opening.
Every row reads a properly formed market. If the market was thin at a checkpoint, say a burst of non-runners or a quiet Irish morning, the row takes the last properly formed market before it, so a price nobody could have backed never shows up as a move. The peak and Holding follow the same rule.
Read down Since opening and you see the shape of the market: whether the money came the evening before, in the morning or late on. Danseuse had most of her move by 10am, +7.6 pts, and peaked at 16:40.
The trainer button
Under the table, a green button names the trainer. For Danseuse it reads How do Simon Crisford's runners do when backed like this? For a drifter it ends when they drift like this? It opens the trainer market record. Premium members see an Upgrade to Professional button here instead, because the record is for Professional members.
The trainer market record
The record carries the trainer's name, as in John & Thady Gosden when the money comes or goes. It takes every runner from the yard for which we hold properly formed exchange markets, going back as far as February 2021, and groups them by how far the price moved from the opening to 60 minutes before the off. The line under the title says when the yard's record starts: for John & Thady Gosden, February 2021, because the record also counts the yard's runners as John Gosden.
A yard keeps its record when its licence changes name. Simon Crisford trained as Simon & Ed Crisford until October 2026, and his record counts the runners under both names, with including as Simon & Ed Crisford under the title so you can see it. A name only joins when it is clearly the same yard: the same surname, one name stopping as the other starts, and the horses moving across. Other trainers who share a surname keep their own records.
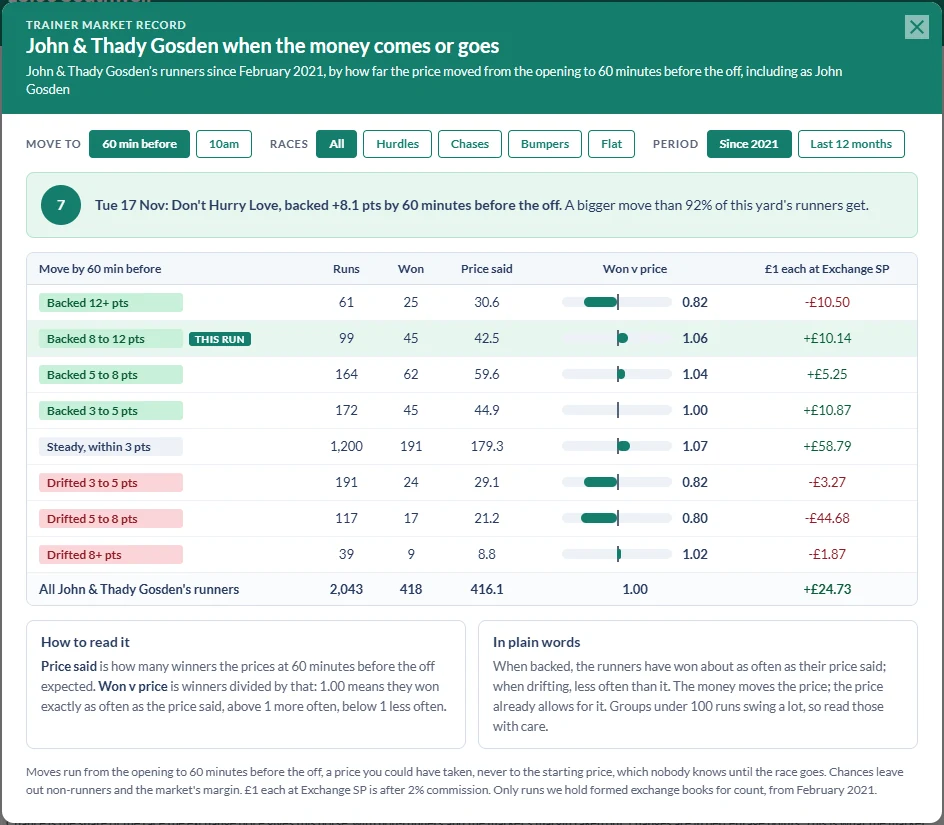
The switches
- MOVE TO: 60 min before or 10am. The 10am record only covers races off at 10:30 or later.
- RACES: All, Hurdles, Chases, Bumpers or Flat.
- PERIOD: Since 2021 or Last 12 months.
The rows
Runners are grouped by the size of their move: Backed 12+ pts, Backed 8 to 12 pts, Backed 5 to 8 pts, Backed 3 to 5 pts, Steady (within 3 pts), Drifted 3 to 5 pts, Drifted 5 to 8 pts and Drifted 8+ pts, with a row for all the trainer's runners at the bottom. The band today's horse falls in carries a TODAY tag, or THIS RUN when you open the record from a past race.
The columns
- Runs: how many runners in the band.
- Won: how many of them won.
- Price said: how many winners the prices at that point expected. Add up the chances of every runner in the band: 10 runners at a 20% chance each come to 2 winners.
- Won v price: Won divided by Price said. 1.00 means they won exactly as often as the price said, above 1 more often, below 1 less often.
- £1 each at Exchange SP: the profit or loss from £1 on every runner at the Exchange SP (XSP), after 2% commission.
The Today line
Above the table, the Today: line names the horse and its move by that point. Open the record from a past race and the line starts with that race's day instead, such as Tue 17 Nov:. Where the yard has at least 100 moves on file, it also says how the move compares with the yard's other runners, for example "A bigger move than 92% of this yard's runners get".
Reading it
Take Don't Hurry Love, backed +8.1 pts by 60 minutes before the 18:00 at Southwell. The John & Thady Gosden record has 2,043 runners since February 2021, counting the yard's runners as John Gosden: 418 of them won, where the prices said 416.1. That is a Won v price of 1.00. Across the whole yard, the market has had their runners about right.
Her band, Backed 8 to 12 pts, has 99 runs, 45 winners and a Price said of 42.5, so 1.06. That is under 100 runs, and the band above it, Backed 12+ pts, reads 0.82 on 61. Groups that small swing a lot, and a few winners either way can take a band from well above 1.00 to well below it. That is why the In plain words box tells you to read them with care.
How to read it explains Price said and Won v price for the switches you have on, and In plain words sums up the yard's record in a short sentence.
Moves run to a price you could have taken, 60 minutes before the off or at 10am, never to the starting price, which nobody knows until the race goes. Today's runners join the record the next morning.
What it is not
This is what the market has done, not a tip. When we tested 319,021 runners, backed horses won far more often than the rest, but only about as often as their new price said. Following the money did not make a profit at any price you could take, and lists of yards where it "works" did not repeat from one period to the next.
So treat a big move, a move that is holding, or a yard's record as context: a reason to look at the race again alongside the ratings, never a system on its own.
Was this article helpful?