
Trainer form by month: which yards come alive now
Some yards have a time of year. A jumping stable that is quiet all summer can start firing in October. The trainer hover now shows you, month by month, when each one tends to be at its best.
This came from a member, Tim, who pointed out that plenty of yards are at their best at a set time of year, particularly over jumps. A stable can look cold on its last-14-days figure in September and be a different operation by November. The trainer hover now ends with a section that puts that in front of you. It is a Premium and Professional feature.
Where to find it
Hover any of the trainer stat columns on the racecard, the T SR group, and the hover opens with the yard's overall record, recent form and angles as before. The month section is at the bottom of that card, so scroll down it.
The trainer columns sit a long way to the right of the ratings grid, so you will need to scroll the table sideways to reach them.
What it shows
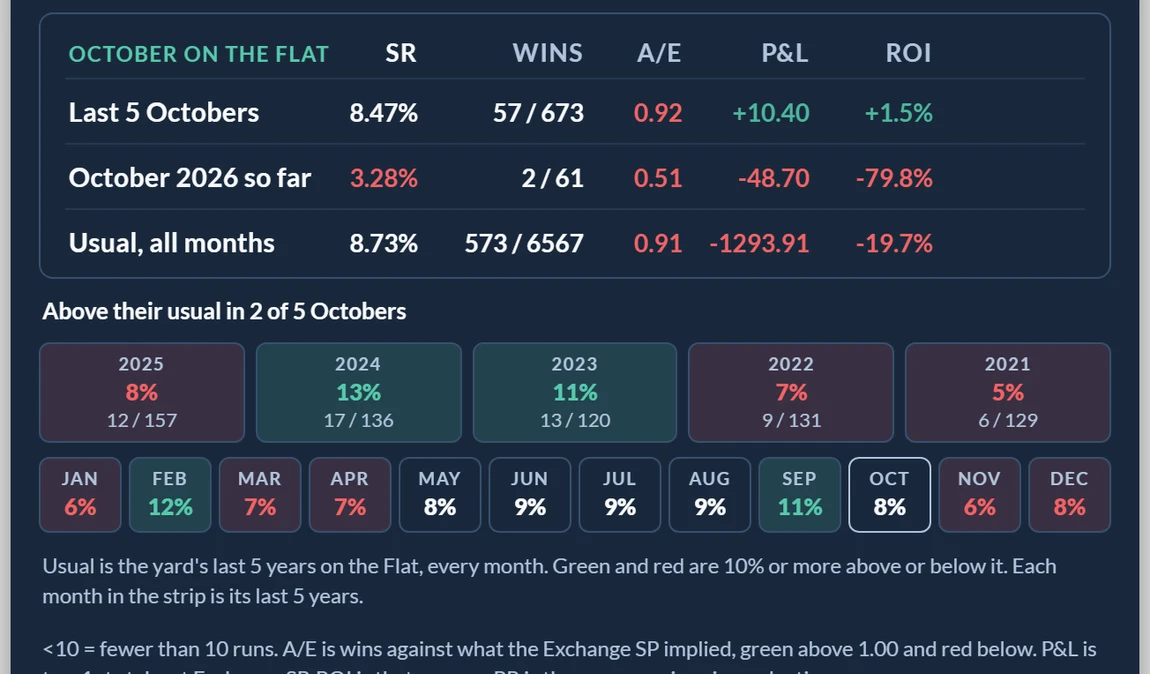
The heading names the month and the code, for example October on the Flat. Jumps and Flat are counted separately, because they are different operations for most yards and a combined figure would hide exactly what you are looking for.
Three rows:
- Last 5 Octobers: the yard's record in the last five completed Octobers.
- October 2026 so far: how it is going this time, which is often a very small sample early in the month.
- Usual, all months: the same yard across every month of the last five years. This is the comparison that makes the top row mean something.
Each row gives the strike rate, wins from runs, A/E, P&L and ROI. A/E is winners against what the Exchange SP implied, so above 1.00 is more winners than the market expected. P&L is to a 1pt stake at Exchange SP and ROI is that per run.
Season by season
Under the table, a line counts how often the yard actually beat its own usual level: above their usual in 2 of 5 Octobers. A chip for each of the last five seasons gives that year's strike rate and the wins from runs behind it, coloured green when it was well above the yard's usual and red when it was well below.
That line matters more than the headline. A five-year total can be carried by one good autumn, and the chips show you whether it is a habit or a single year doing the work.
The twelve month strip
Finally, every month of the year with the yard's strike rate in it, the current month outlined. Green is 10% or more above the yard's usual rate, red is 10% or more below. In the example the yard's strongest months are February and September, and October is merely ordinary.
A cell marked <10 had fewer than ten runs, which is a nudge to ignore it rather than read something into it.
How to use it, honestly
Liam's view when this was built was that members can judge it for themselves, and that is the right way to take it. We have not tested whether a strong month repeats, and plenty of seasonal patterns in racing are the by-product of where a yard's horses happen to be aimed rather than anything that carries forward.
So use it as a question rather than an answer. A yard that has beaten its usual level in four of the last five Octobers, with the runs to back it up, is worth a second look at the price. One good October out of five, on 30 runs, is noise.
Where a training partnership has taken over from a solo trainer, the record includes the yard before the licence changed, the same as the Ch1 and Hu1 records do.
Was this article helpful?