
The Run Details hover
The Run Details card behind every R figure carries 3 panels: Race Context, Performance, and Ratings & Prices. Here is what each row means, including the newest additions.
Hover any R figure on the racecard (or tap it on a phone) and the Run Details card opens for that run.
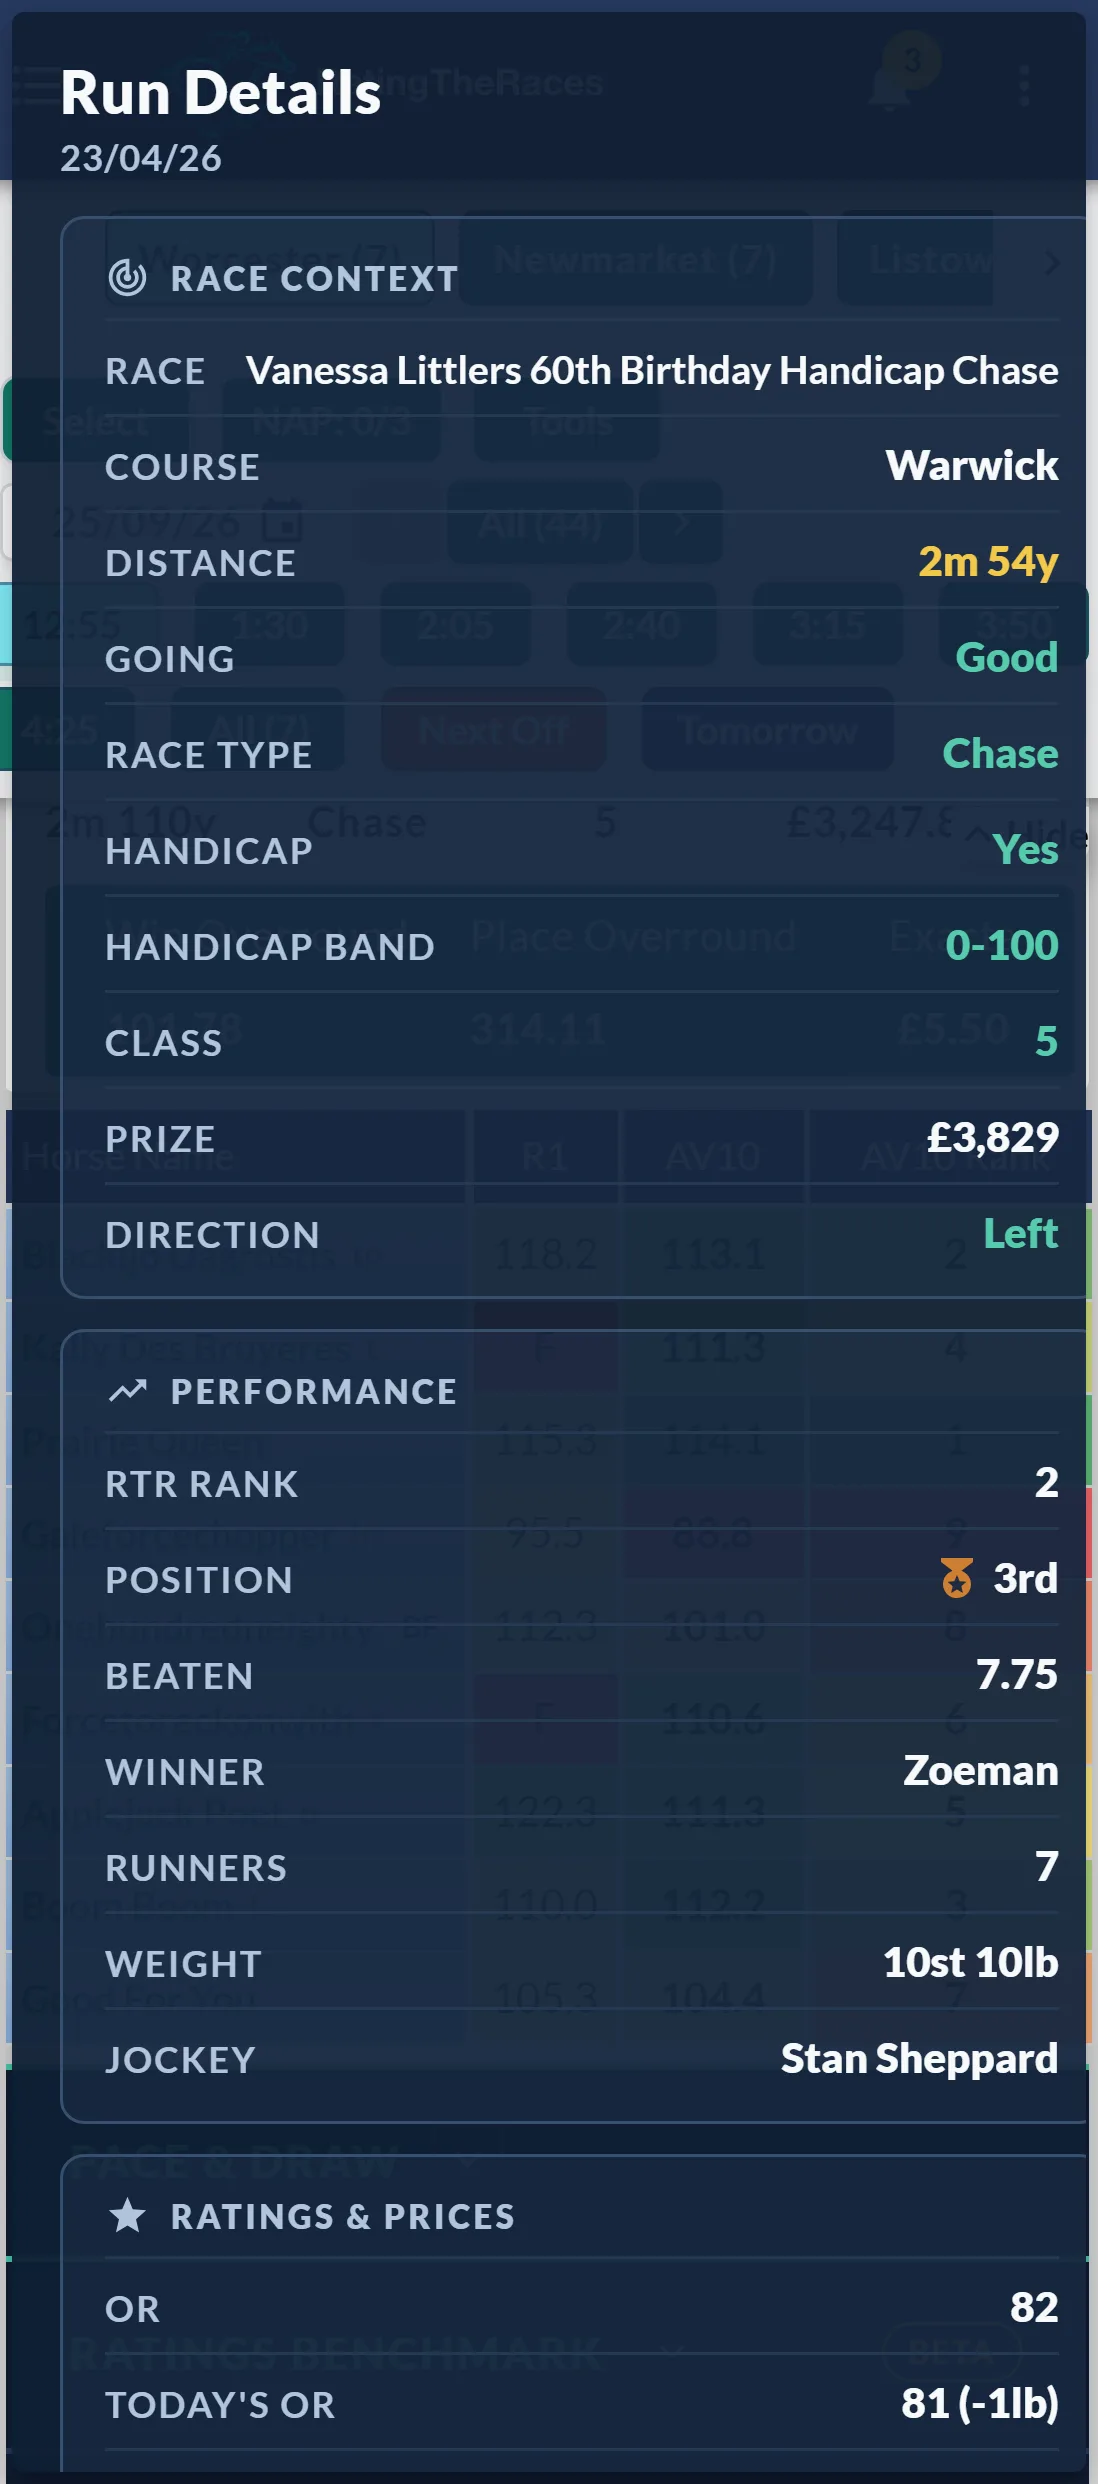
Race Context sets the scene: the race's own name with the winner's prize, course, distance, going, race type, whether it was a handicap and, when it was, the Handicap Band (a 0-100 band tells you the grade of handicap at a glance). Class names the actual grade where there is one, so a Group 2 reads Group 2, not Class 1. A green figure matches today's race exactly, amber is a near match, so you can see in a second how relevant the run is to today.
Performance covers the run itself: RTR Rank on the day, finishing position, with gold, silver and bronze medals picked out on a 1st, 2nd or 3rd, distance beaten, the winner (or what it beat), field size, weight carried and the jockey.
Ratings & Prices holds the marks and the market: the OR it ran off against today's, ISP and Exchange SP, the in-running low and high, and how the market moved before the off.
Since October two of those are easier to read. IR Low % gives the in-running low as a percentage of the Exchange SP, so a horse returned at 9.00 that traded as low as 4.50 reads -50%: the quickest way to spot one that travelled into the race looking like the winner and then did not get home. The Market row now carries the move as a percentage as well as the two prices, reading Drifted 6.13 to 9.00 (+47%) rather than leaving you to do the sum.
And the footer reminds you of the shortcut: click the figure and the race opens in a new tab.
The Run Details hover is available to Premium and Professional members.
Was this article helpful?