
We have shipped a lot this summer, and a fair amount of it is the sort of thing you only find by accident. So here are 5 of the newest additions, what each one is for, and where to find it.
1. The Horse Database: every horse as it stands today
The Horse Database is a lookup rather than a results tool. One row per horse, showing what that horse is now: the official rating it holds today, the mark it last ran off, who trains it, how old it is and how long it has been off.
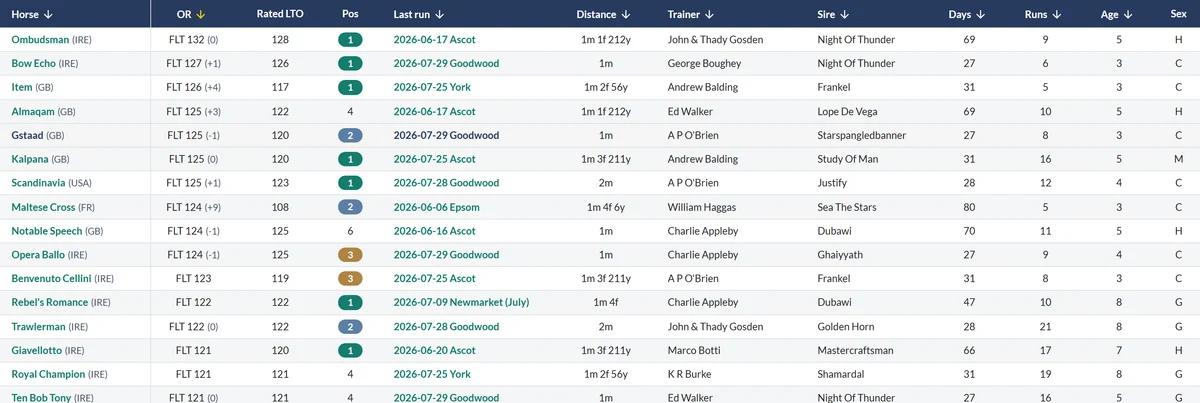
The reason it had to exist separately is simple. A results database can only ever show you the mark a horse carried in a race, so a horse that wins its maiden, gets given a mark of 112 and does not run again is invisible to it. Filter our database to 2yos and most of the top of the list has never run off a rating at all.
There is a full write-up here. It is part of a Professional membership.
2. Weight carried, and the hover behind it
Hover a horse’s name and you now get its record by the weight it actually carried.
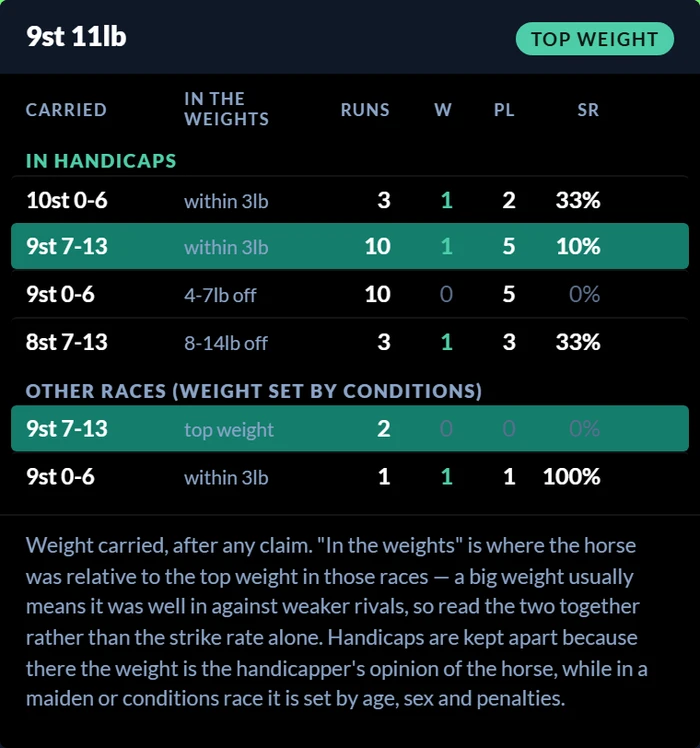
Two decisions in there are worth explaining, because they are the difference between a useful table and a misleading one.
First, we show what was carried, not what was allocated. Those differ whenever a claimer rides, and using the allocated figure would quietly move those horses into the wrong band after the race.
Second, handicaps are kept apart from everything else. In a handicap the weight is the handicapper’s opinion of the horse. In a maiden or a conditions race it is set by age, sex and penalties. Merge them into one table and a horse reads as having failed under a weight it was simply allotted. Today’s type of race is shown first.
The In the weights column is the one to read alongside the strike rate: it tells you where the horse sat relative to the top weight. A big weight usually means it was well in against weaker rivals, so the 2 columns only make sense together.
3. The R figure hover, rebuilt
Every R figure on the card is a run, and hovering it has always opened the detail. That hover has been rebuilt into 3 cards and given a good deal more in it.
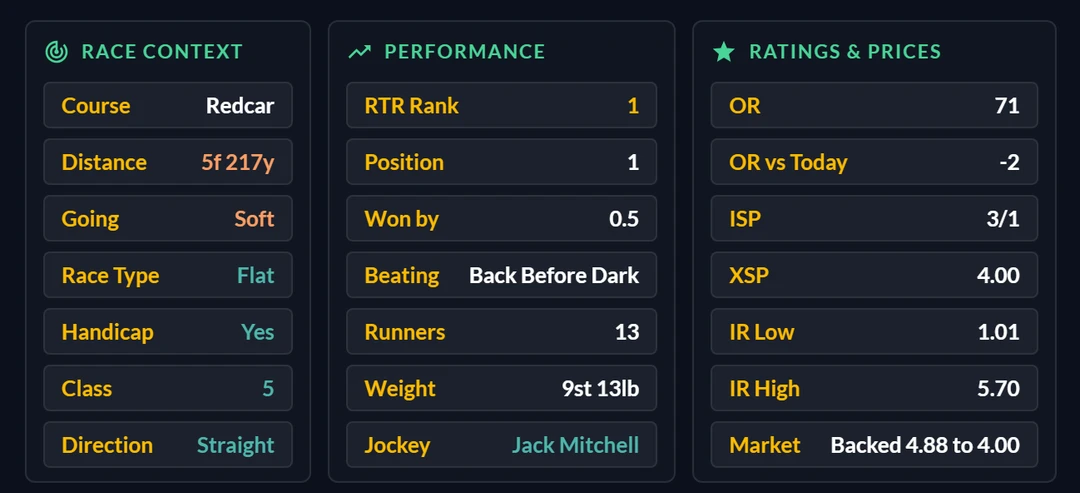
Race Context is the shape of the race: course, distance, going, race type, whether it was a handicap, the class and the direction. Anything matching today’s race is highlighted, so a course and distance match jumps out without you hunting for it.
Performance is what the horse did: our rank that day, finishing position, the winning or beaten distance, the horse it was beating or chasing, the field size, the weight carried and the jockey. The jockey is highlighted when it is the same rider as today.
Ratings & Prices is the market: the official rating that day and how it compares with today’s, the industry price, the Exchange SP, the in-running low and high, and whether the horse was backed or drifted through the morning.
That last row is the newest. “Backed 4.88 to 4.00” tells you the money came for it. The in-running high, shown for winners, tells you how far it was in trouble before it got there.
4. The stats hover, rebuilt
Every strike rate column on the card opens a full breakdown when you hover it, and that card has just been rebuilt so the headline number is not buried in a table.
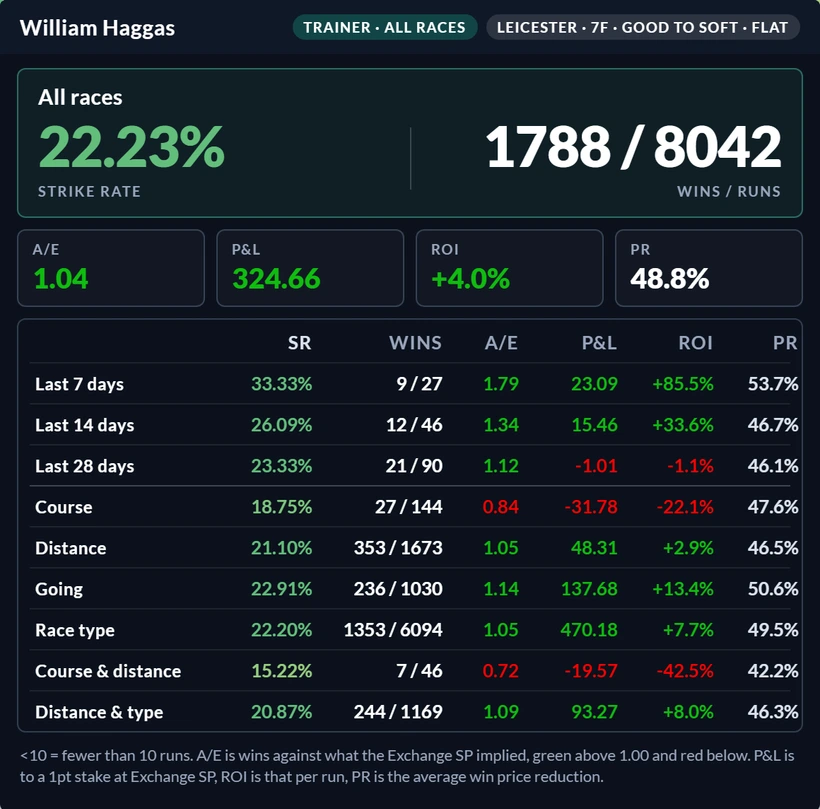
The header tells you what you are looking at: the name, whether it is the trainer, jockey or sire, and the conditions of today’s race, so there is no doubt what the numbers are being measured against.
Below that sits the overall record as the hero figure, with wins and runs alongside it, and then 4 tiles that are the ones worth acting on:
- A/E — wins against what the Exchange SP implied. Green above 1.00, red below.
- P&L — profit or loss to a 1pt stake at Exchange SP.
- ROI — that profit expressed per run.
- PR — the average amount the win price shortened.
A/E is the one we would point you at. A yard can post a fat strike rate simply by running short-priced favourites; A/E asks whether it wins more often than those prices said it would. Above 1.00 it is beating the market, below it is not, and that is a different question from whether it wins a lot.
The table underneath then repeats all 6 figures across every angle: the last 7, 14 and 28 days, the course, the distance, the going, the race type, and the combinations of course and distance and distance and type. Anything with fewer than 10 runs is flagged, so a 1 from 2 does not get read as a trend.
5. Better Tools toggles
Everything that used to be scattered across menus now sits in one Tools panel, grouped by where it actually appears on the page.

A few worth knowing about:
- Freeze Horse Name and Freeze Horse Picker pin the name column, and the tick and NAP columns, while you scroll sideways through the stats.
- Class vs Same Race Type measures the class change against the horse’s last run of today’s type rather than simply its last run, which matters for anything switching between codes.
- Last Time Out NAP Comp puts a badge on horses you NAPped last time out.
- Quick Switch on the Toolbar puts the WS / PS / WP switch next to the Tools button so you can move between win stats, place stats and price reduction without opening anything.
That last one is the Stats View section, and it is worth understanding. WS makes every stat column a win strike rate. PS makes the same columns a place strike rate, which is what you want for each-way and place markets. WP is not a strike rate at all: it is the average percentage the win price shortened in running.
Where to find all of this
The hovers are on every racecard, and the first race of every day is free to everybody, logged out included, so you can go and try them now. The Tools panel is the button on the racecard toolbar. The Horse Database sits under Stats.
If you want the full picture of what sits at which membership, we set that out in Free vs Premium vs Pro.