
Plenty of racecards will tell you that a horse was a beaten favourite last time out. It is one of the most commonly displayed notes in the sport. We have just added it to ours as well, after a member asked for it.
Here is our problem with it. On its own, that flag is close to useless.
Why the bare flag tells you nothing
Picture 2 horses. Both carry the beaten favourite marker. The first was sent off 4/6, got badly hampered, and stayed on into 3rd without ever getting a clear run. The second was sent off 4/6, travelled like a winner, was asked to go and win his race and found absolutely nothing.
The first horse is a bet next time. The second is one to swerve, possibly for a long while. They carry exactly the same flag.
That is before you get to the more basic problem: on average, a horse being beaten as favourite is a mildly negative signal, because the market has just been proved wrong about it. Yet it gets displayed as though it were a positive, a horse "due" to put it right. Neither reading is much good without something underneath it.
What we show, and why the trainer is the part that matters
Hover over the BF badge next to a horse's name on any of our racecards and you get the whole story rather than the flag.
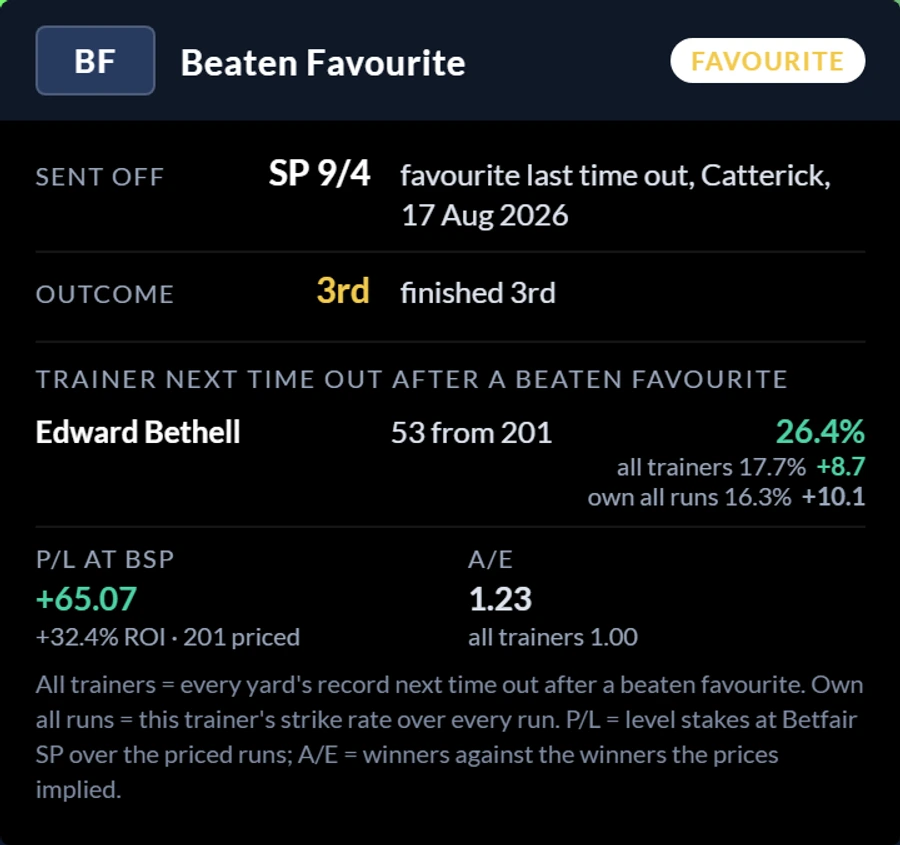
First the facts of the run itself: what price he was sent off, at which track, on what date, and how he actually finished. Fallers and pulled-up obviously count as beaten, and the card tells you that is what happened rather than quietly showing a blank.
Then the bit nobody else puts in front of you: what this trainer does next time out after a beaten favourite. Not the yard's general strike rate. Their record at this exact angle, over every runner they have had in that position.
The trap: measuring a yard against itself flatters everybody
When we first built this, we compared each trainer's record at the angle to their own strike rate across all runs. It looked terrific. Almost every yard came out positive, some of them dramatically so.
That comparison is close to worthless, and it took us a round of building to see why. A horse that went off favourite is, by definition, one of the horses in the yard expected to win. Comparing its follow-up run to the trainer's average runner, which includes every no-hoper they send out, is not a fair fight. Of course the number goes green.
So we worked out the real yardstick. Across 102,564 qualifying runs, there were 18,193 winners next time out after a beaten favourite. That is 17.7%.
That is the number a trainer has to beat. Not their own average. The population.
It reframes the whole thing. A yard running at 14% at this angle might look 5 points better than its own baseline and still be well below what everybody else manages. We show both figures, with the population one first, because that is the one that answers the question you are actually asking.
Strike rate is still not the whole answer
There is one more step, and it is the step that most stats tables skip.
Knowing a yard wins 23% of the time at an angle is useless if the market already knows it and prices them at 5/2 every time. So we also show, over the same runs, the profit or loss to level stakes at Betfair SP and the A/E, which measures actual winners against the winners those prices implied.
Across the whole population, A/E comes out at 1.00 and level stakes returns -1.9%. Read that carefully, because it is the single most useful fact on this page: as a blanket angle, backing horses next time out after a beaten favourite is priced almost exactly right. There is no free money in the flag. The entire value is in working out which yards beat it.
4 examples from today's cards
| Trainer | Record at the angle | vs all trainers 17.7% | vs own all runs | P/L at BSP | A/E |
|---|---|---|---|---|---|
| Edward Bethell | 53 from 201 (26.4%) | +8.7 | +10.1 | +65.07 (+32.4%) | 1.23 |
| Ralph Beckett | 192 from 826 (23.2%) | +5.5 | +5.6 | +148.99 (+18.0%) | 1.06 |
| Michael & David Easterby | 30 from 216 (13.9%) | -3.8 | +4.9 | -15.74 (-7.3%) | 0.93 |
| Scott Dixon | 26 from 205 (12.7%) | -5.0 | +5.5 | +17.98 (+8.8%) | 1.12 |
Look at the 3rd and 4th columns together, because that is the whole argument in one place. Every single one of these yards is positive against its own baseline. Two of them are well below the population figure. If you only had the own-baseline number, as we very nearly shipped, you would have concluded that all 4 were good at this. Two of them are not.
And then there is Scott Dixon
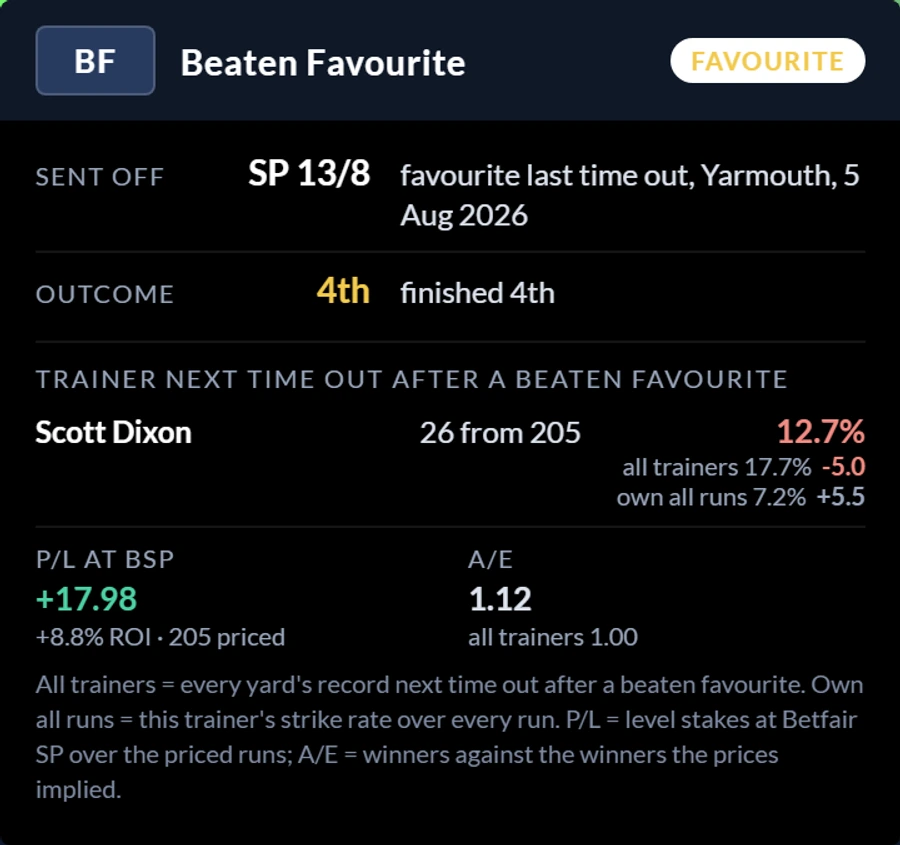
His strike rate at the angle is 12.7%, a full 5 points below the population. On strike rate alone you would leave him alone. Yet his A/E is 1.12 and level stakes at Betfair SP shows a profit of 17.98 over 205 runs.
Both things are true. He wins less often than most yards do in this spot, and he still returns a profit, because the market prices his runners more generously than their record deserves. A strike rate table would have told you to ignore him. A P/L and A/E table would have told you to back him. You need all of it.
Edward Bethell is the opposite kind of case and much simpler: 26.4% at the angle, nearly 9 points clear of the population, an A/E of 1.23 and a thumping level stakes profit. That is a yard that is genuinely good at this and is not yet fully priced for it. Ralph Beckett does much the same thing over 826 runs, which is a sample size you can lean on rather hard.
How to use it
The marker sits next to the horse's name on the racecard, in the same place as our headgear letters. Hover it, or tap it on a phone, and the full card opens.
What we would suggest is this. Treat the flag itself as a question rather than an answer. Then read the 3 lines underneath it in order: is this yard above or below the 17.7% that everybody else manages, is the market already paying attention, and what actually happened in the race that earned the flag in the first place.
The figures refresh every night, so a yard's record is current rather than something we computed once and left.
This is the same principle behind everything we have added this summer, including our headgear records, where the honest numbers turned out to say the opposite of the received wisdom. A flag on a racecard is not information. A flag with a population baseline, a price-adjusted return and a sample size behind it is.